It builds itself
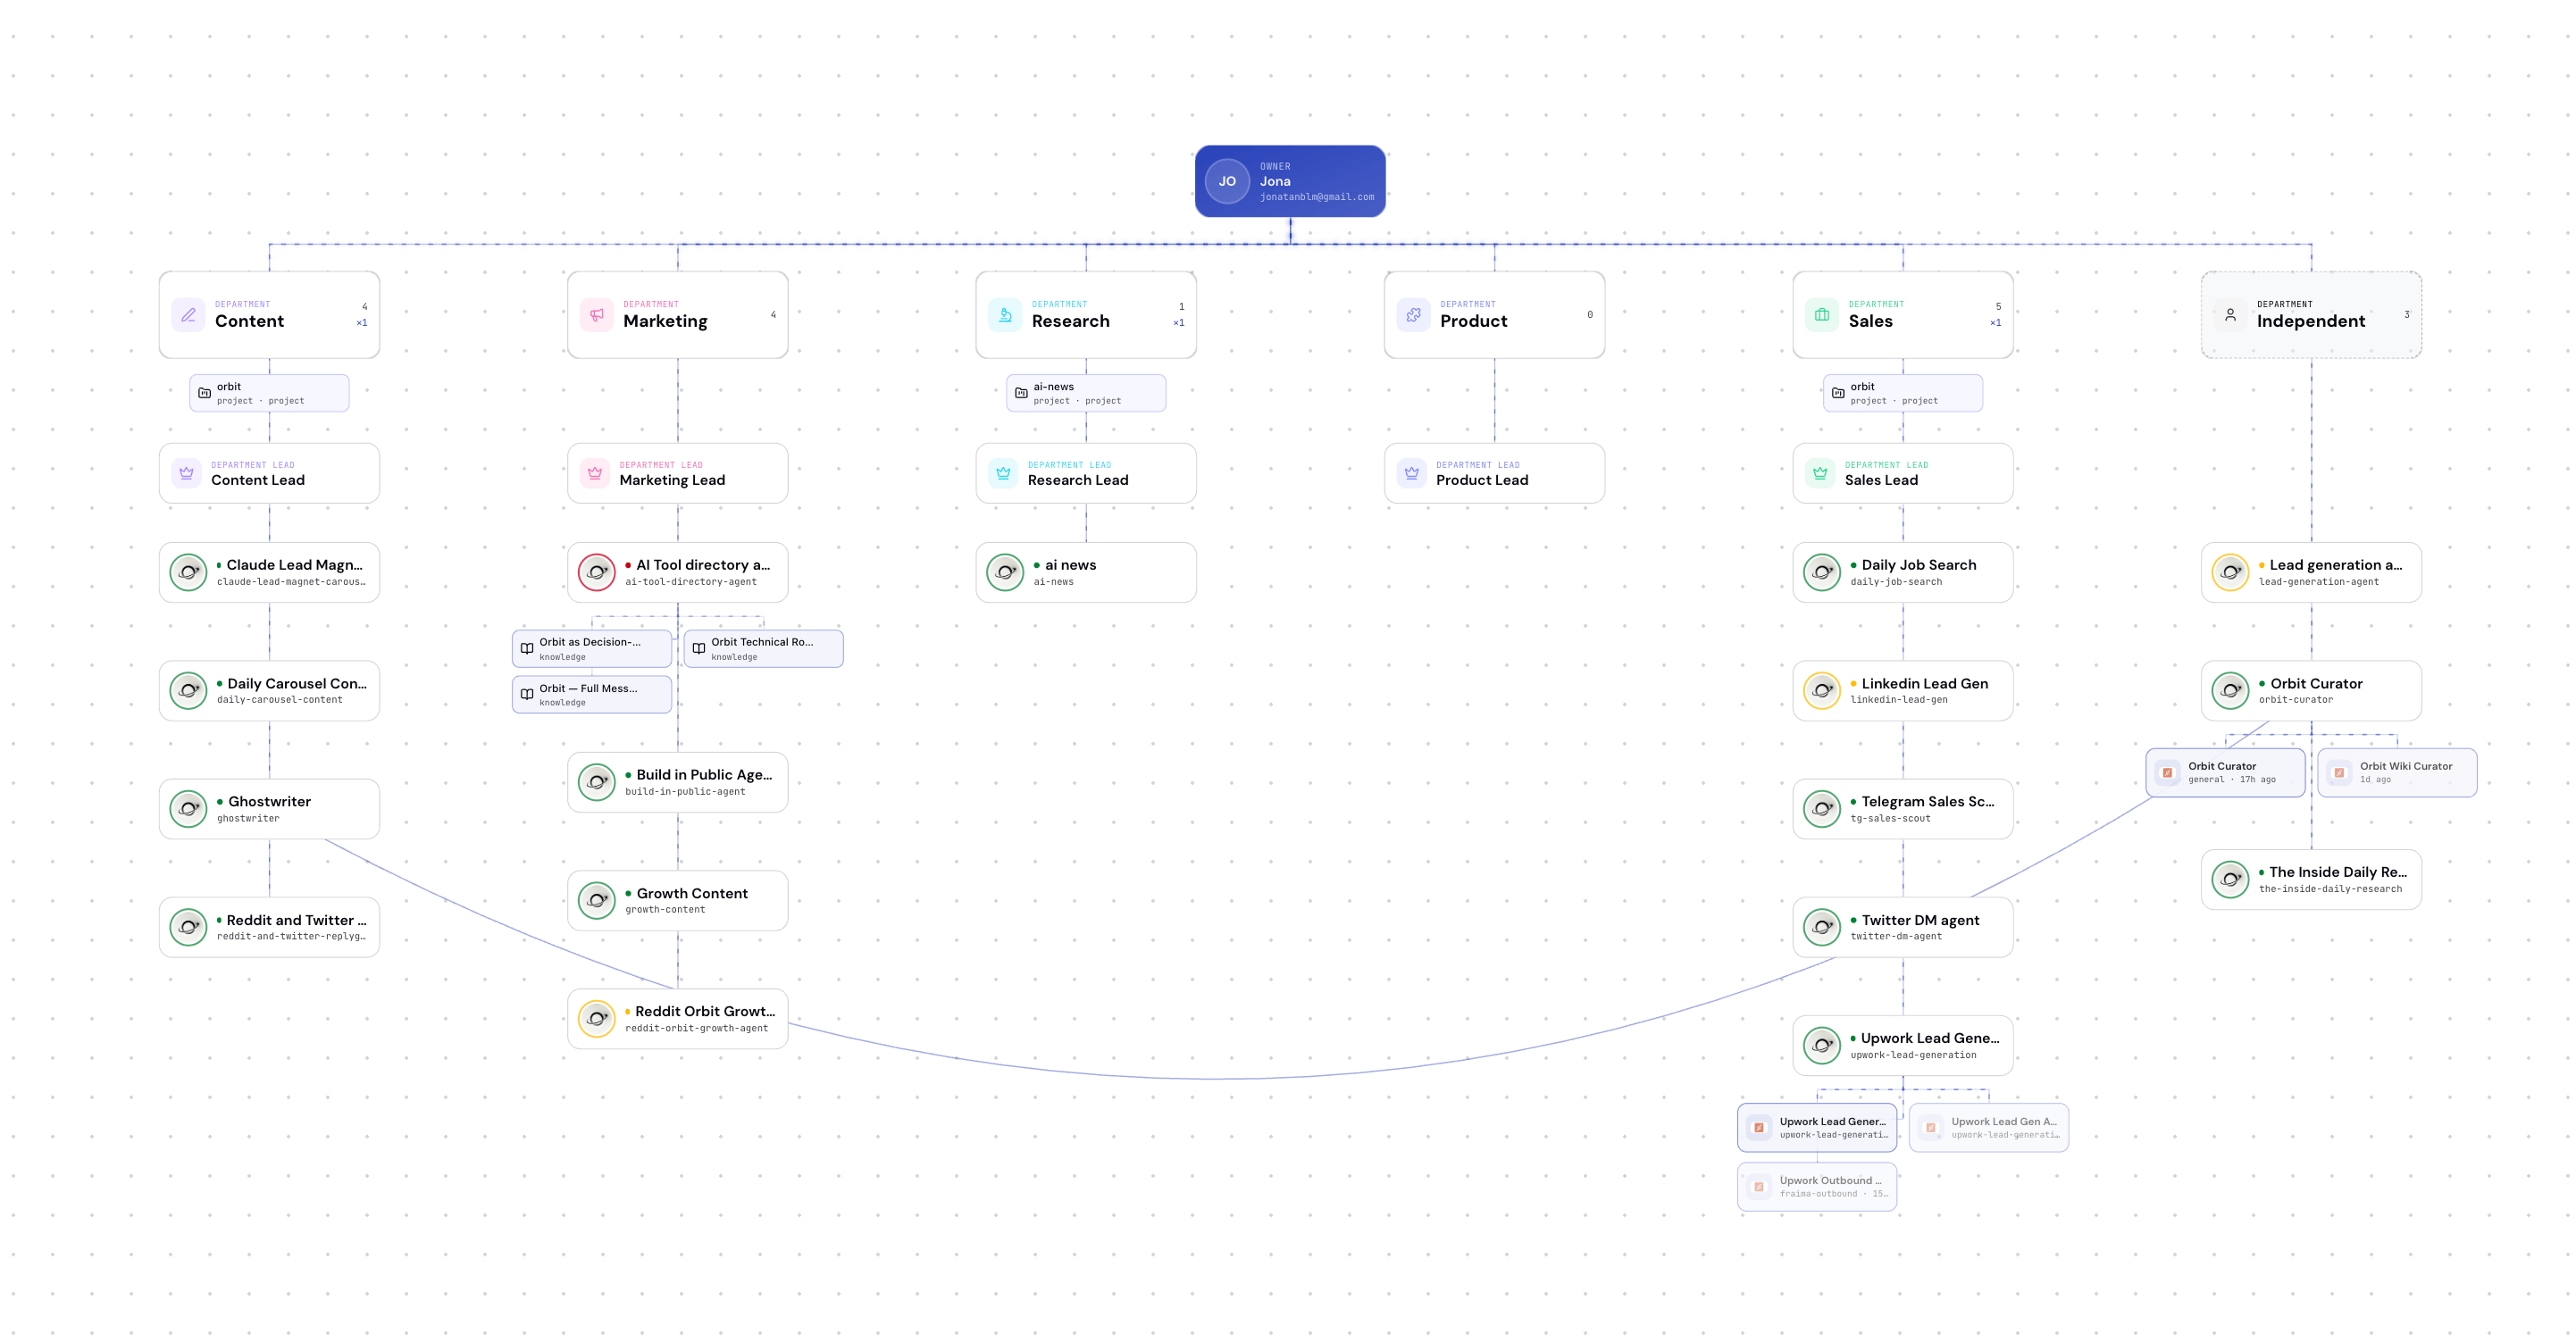
You don’t draw the org chart manually. It assembles as agents connect and get assigned to departments. At a glance you can see:- Which departments exist and how many agents are in each
- Which agent leads each department
- Which agents are currently on shift vs. idle
- The relationships between agents
Why visualize it
When you’re running a handful of agents, a list is fine. When you’re running an AI-native team across sales, research, content, and ops, you need to see the shape of it — who’s doing what, where the gaps are, which department is overloaded. The org chart turns an abstract pile of agents into a company you can actually manage.Organize your org chart
Assign departments and structure your workforce.